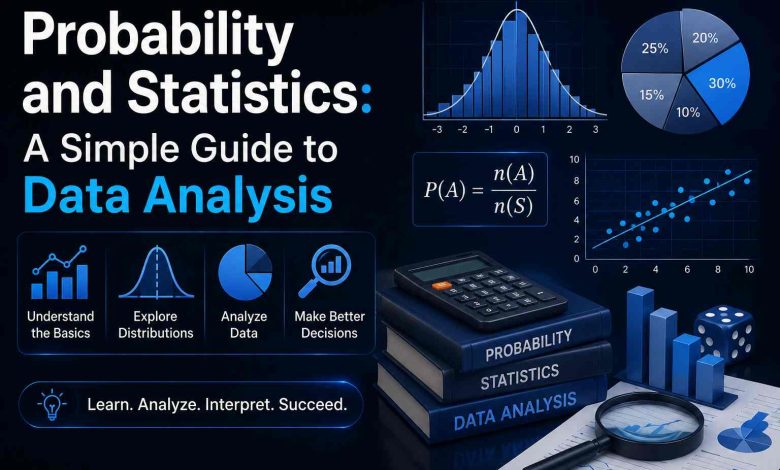
Learn probability and statistics in simple English. Understand data, chance, averages, distributions, and real-life uses with this easy guide.
The concepts of probability and statistics are fundamental in mathematics. They assist us in the comprehension of data, events, patterns, and uncertainty. These ideas are applied in many aspects of our everyday lives. They are used by students, teachers, businesses, and scientists all for making better decisions.
Probability and statistics might seem challenging at first. But, the core concepts are not as difficult as they sound. After learning the key terms, formulas and examples, the material makes much more sense.
What Is Probability?
Probability is the study of chance. It provides information about the probability of an event occurring.
Suppose, for instance, you flip a fair coin. There are two possible results. The coin may land on heads or tails. If the coin is fair then the chance of getting heads is 1/2.
Probability is typically expressed as a number from 0 to 1.
The number ‘0’ implies that something cannot happen.
1 means an event is certain.
The number from 0 to 1 indicates different levels of possibility.
For instance, if there is a 0.25 probability of an event, then there is a 25% chance that the event will occur.
In situations of uncertainty we use probability to help us. Does not always tell us what will happen. Rather, it allows us to gain insight into the probability of various results.
Basic Terms Used in Probability
Learning some basic vocabulary simplifies probability.
Experiment
An experiment is an activity that has an outcome. Simple examples are tossing a coin or rolling a dice.
Outcome
An outcome is a result that can happen when conducting an experiment.
Heads or Tails- these are the possibilities for a coin toss.
Sample Space
All possible outcomes are included in the sample space.
The sample space for a dice roll is:
{1, 2, 3, 4, 5, 6}
Event
An event is a collection of outcomes or one of them for which we are interested.
For example, getting an even number when rolling a dice is an event. The possible favourable outcomes are 2, 4 and 6.
More Read : Success motivational quotes
What Is Statistics?
Statistics involves gathering, organizing, analyzing and interpreting data.Numbers, measurements, answers, observations or information that is useful.
For instance, a teacher could record the scores from 30 students on a test. The teacher can use statistics to gain an understanding of the class’s overall performance.
Statistics can help answer such questions as:
- What is the meaning of the scores?
- What is the maximum?
- Which number is the smallest?
- Are the scores widely distributed?
- What do you notice about this data?
When there is a lot of information to be understood, then statistics are useful.
Types of Statistics
There are two basic types of statistics: descriptive statistics and inferential statistics.
Descriptive Statistics
Descriptive statistics deals with summarizing data that is already available.Uses averages, percentages, tables, charts and graphs.
For instance, if a shop registers the sales for one month, descriptive statistics can display the total sales and the average sales per day.It assists to convert tons of information to information that is easy to understand.
Inferential Statistics
Inferential statistics take it one step further. Uses information from a sample to make reasonable deductions about a larger population
Researchers, for instance, might ask 500 people about a certain product. The results can give valuable insights into the views of a much larger group.When drawing inferences from a sample to a larger population, some uncertainty is introduced and is commonly used in inferential statistics.
Understanding Mean, Median, and Mode
Mean, median, and mode are some of the most common statistical concepts.
Mean
The mean is commonly called the average.
To calculate it, add all the values and divide the total by the number of values.
For example:
10 + 20 + 30 = 60
There are three numbers, so:
60 ÷ 3 = 20
The mean is 20.
Median
The median is the middle value when numbers are arranged from smallest to largest.
For example:
5, 8, 12, 15, 20
The middle number is 12, so the median is 12.
If there are two middle numbers, their average is used to find the median.
Mode
The mode is the value that appears most often.
For example:
2, 3, 3, 5, 7
The number 3 appears twice. The other numbers appear once. Therefore, the mode is 3.
These three measures help summarize data in different ways.
Understanding Range and Variation
Statistics is not only about finding averages. It is also important to understand how values differ from one another.
The range is the difference between the highest and lowest values.
For example:
10, 15, 20, 25, 30
The highest value is 30 and the lowest is 10.
So:
30 − 10 = 20
The range is 20.
Other statistical measures, such as variance and standard deviation, can provide more information about how much data values vary from the average.
This is useful because two groups can have the same average but very different patterns.
Probability and Statistics Together
The concepts of probability and statistics are closely related.Probability usually begins with a model or situation and asks what will/can happen. Statistics always begins with data gathered and from the gathered data they analyze a situation.
For instance, probability can be used to make estimates on the probability of an event occurring. This then allows the study of actual observations and comparison with expectations, using statistics.Both subjects are important for study and decision making because of this link.
Real-Life Uses of Probability and Statistics
Probability and statistics are not “classroom only” subjects. They are applied in various practical applications.
Business
Statistics are used by businesses to investigate sales, preferences and trends in the market. This information can be utilized to inform businesses about their performance and to make plans for future activities.
Education
Statistics are used by schools to research the outcomes of exams, presence and other educational records. The information can be used by teachers to analyze students’ performance.
Science
Data is obtained and interpreted in experiments. They can use statistics to look for patterns and to check their outcomes.
Weather Analysis
Data and probability are applied in the field of weather forecasting. Expert estimates of possible weather conditions are based on historical data and observations.
Sports
Statistics are used to examine the performance of players, the results of sports teams, and game patterns in sports teams. These numbers can assist coaches to gain an understanding of strengths and areas for further development.
Everyday Decisions
Basic statistical thinking is also applied in everyday life. Some form of statistical reasoning is used in comparing prices, analysing percentages, understanding surveys and assessing information.
Why Is Probability and Statistics Important?
A large data set may have thousands or millions of values. It may not be feasible to consider each value on a single case basis. Use statistical methods to summarise the information.
Probability also allows for the ways in which people think about uncertainty. Probability tells us to think about the various possibilities, rather than assuming that something will definitely happen.
These skills are particularly valuable in a world where people are constantly encountering numbers, percentages, charts and data.
Final Thoughts
Probability and statistics are used to gain insight into chance and data. Probability is about the chances of events occurring and statistics is about the collection, organisation, analysis, and interpretation of information.
Basis of concepts are mean, median, mode, range, probability and data distribution. These are helpful in the fields of education, business, science, sport, weather forecasting, and decision making.
Anyone can develop a good sense of probability and statistics with ease and regular practice using simple examples. There’s more to the subject than formulas. It’s also about developing the ability to interpret information and draw logical inferences from information.